Here are 3 infographic templates for Google Drive by Google:
Infographics Toolbox By Google - Illustrate your data with your own custom graphs, charts, maps and more. Draw your own pie charts and bar charts with this template. Edit the colors of the map of the United States. Create an infographic of male and female symbols to use for counting data (including one-half male and female symbols). http://goo.gl/R0Cjh
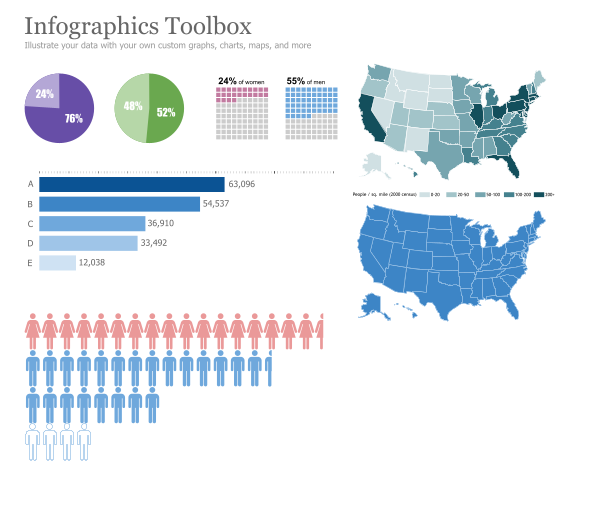
United States Data Map By Google - This map of the United States is shaded based on state-by-state data. Just click on each state and set a custom color based on the information that you want to display. Then adjust the key at the bottom of the drawing to describe your custom data. The default data displayed is the population density from the year 2000 census. Notes: - States with multiple unconnected parts have been created as grouped shapes (eg. Hawaii, Michigan). - Washington DC starts as a grouped shape with Maryland. - Map can be changed to be displayed at any size. Using the same border for all states (eg. 1px white) is recommended. http://goo.gl/KjM3H
Map of the United States (Multi-colored) By Google - This map of the United States is colored with 5 standard colors to distinguish each state outline. Each set of same-colored states is a grouped shape, just click a state and change the color to choose custom map colors for all those states. A gray shadow of the states outlines adds a lightweight 3D effect. http://goo.gl/p58VS
Related reading:
How to Get Started With Infographics | PCWorld Business Center http://goo.gl/ViWk2
How To Create Your Own Infographics: Step By Step Guide and Tips - TechTheBest.com http://goo.gl/pT2mH
Infographics Toolbox By Google - Illustrate your data with your own custom graphs, charts, maps and more. Draw your own pie charts and bar charts with this template. Edit the colors of the map of the United States. Create an infographic of male and female symbols to use for counting data (including one-half male and female symbols). http://goo.gl/R0Cjh
United States Data Map By Google - This map of the United States is shaded based on state-by-state data. Just click on each state and set a custom color based on the information that you want to display. Then adjust the key at the bottom of the drawing to describe your custom data. The default data displayed is the population density from the year 2000 census. Notes: - States with multiple unconnected parts have been created as grouped shapes (eg. Hawaii, Michigan). - Washington DC starts as a grouped shape with Maryland. - Map can be changed to be displayed at any size. Using the same border for all states (eg. 1px white) is recommended. http://goo.gl/KjM3H
Map of the United States (Multi-colored) By Google - This map of the United States is colored with 5 standard colors to distinguish each state outline. Each set of same-colored states is a grouped shape, just click a state and change the color to choose custom map colors for all those states. A gray shadow of the states outlines adds a lightweight 3D effect. http://goo.gl/p58VS
Related reading:
How to Get Started With Infographics | PCWorld Business Center http://goo.gl/ViWk2
How To Create Your Own Infographics: Step By Step Guide and Tips - TechTheBest.com http://goo.gl/pT2mH